


Let's start with Tom Clancy's Ghost Recon Breakpoint because I found several things quite interesting here. Because whether you start the integrated (and preloaded benchmark) or the open world – on the X570 system the first 4-5 seconds were always accompanied by extreme jerks, who then suddenly dissolved into nothingness. When you moved something or the self-running benchmark arrived on the road, everything went smoothand and clean. Since this was a reproducible behavior (only on the AMD platform) (also on an Aorus X570 Elite), I always start the measurements only after this "swinging in". This will hardly bother the player himself, because it only occurs once and at the first entry into the 3D world, for whatever reason. But it's there.
But why a game and, above all, why this one? It's consistent with my own (even visual) experiences, which makes graphics performance in workstation applications. Because a high FPS number does not always say anything when it is concerned with pan and zoom in the 3D views of e.g. Solidworks 2019 or Inventor 2020. In the end, I just want to point out that sometimes the longest bar is not the most important. But I have to go a little further…
Power Consumption vs. Frametime and Core Utilization
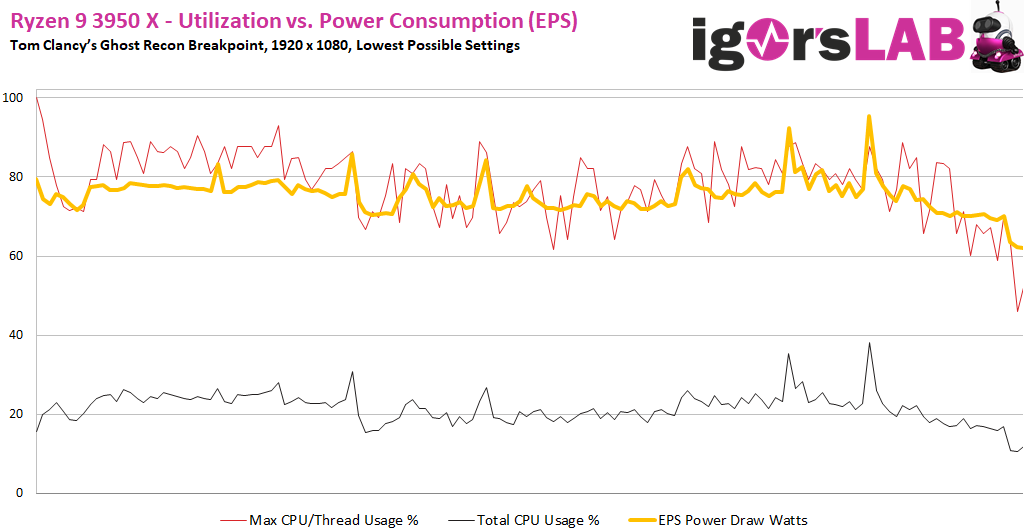
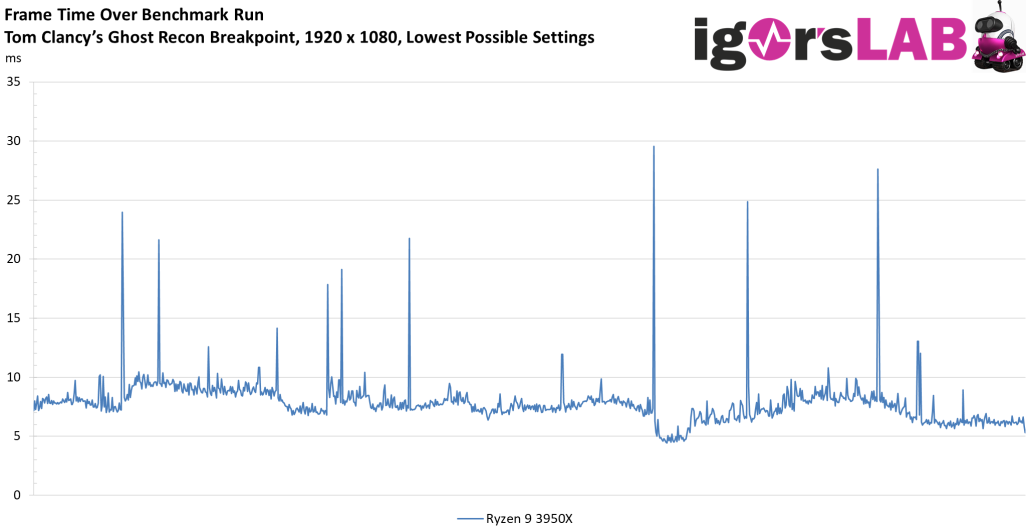
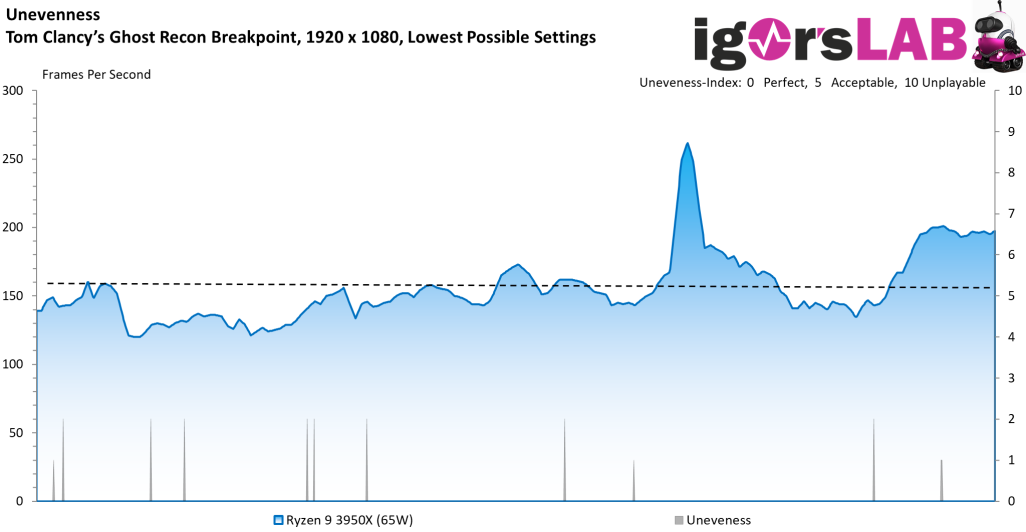
The benchmark run is long enough and consists of very different requirements for CPU and GPU, which is an advantage here than a rather homogeneous single scene. This is exactly why we want to look at the Ryzen 9 3950X first of all and contrast CPU utilization, thread utilization and power consumption with the frametimes, both X axes represent the complete course over the benchmark, so are together perfectly comparable. Nevertheless, for the sake of better comparability, I have separated everything into individual graphics:

The distribution on the threads is rather mediocre and you can see that there is mostly idleness and boredom. By the way, the first possible thread of a core is much more busy.
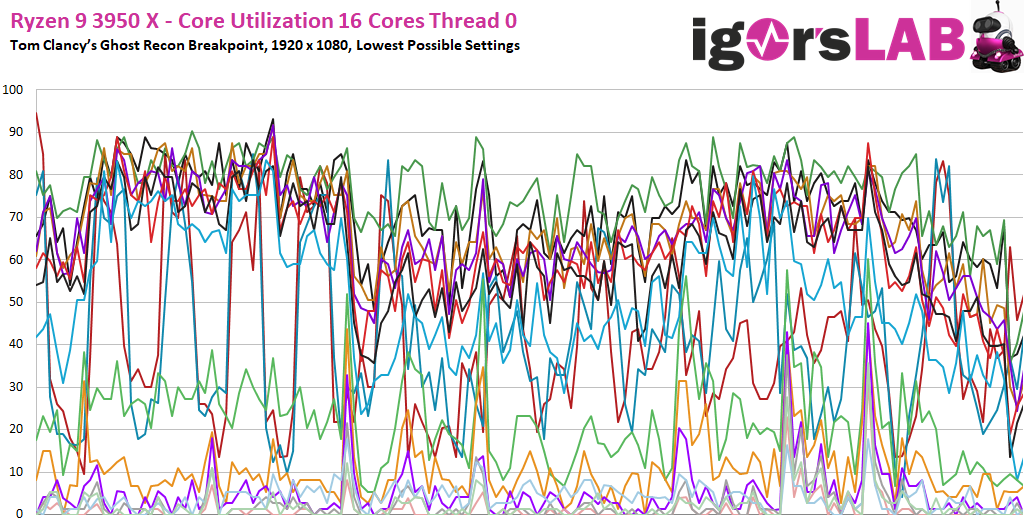
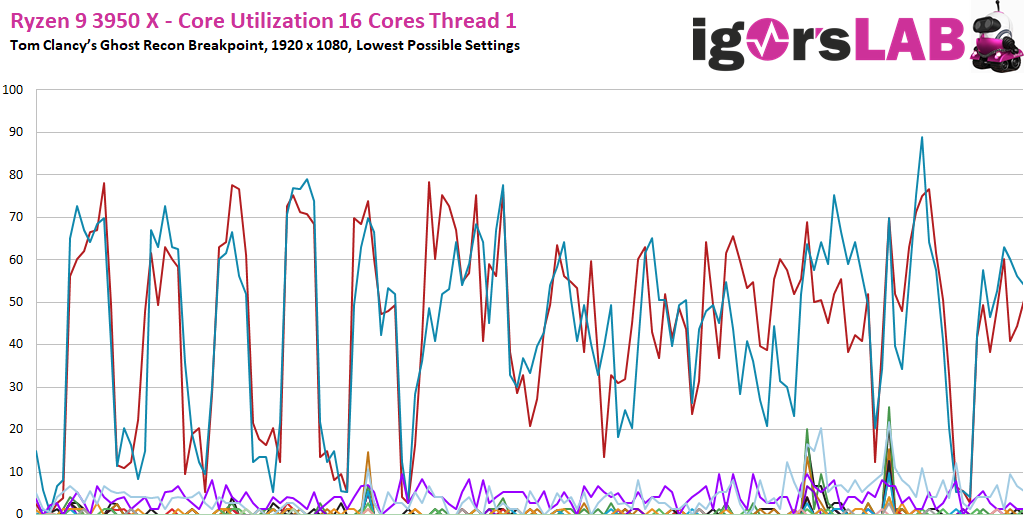
The use of the second thread per core is largely absent. If you turn off SMT, the image above would hardly be different, because the two threads are no longer noticeable. Which proves to us again: 8 cores or 16 threads are actually enough for the gamer of the world at the moment. However, the existence of 8 cores without HT, as with the Core i7-9700K, is also a realization that this game offered me.
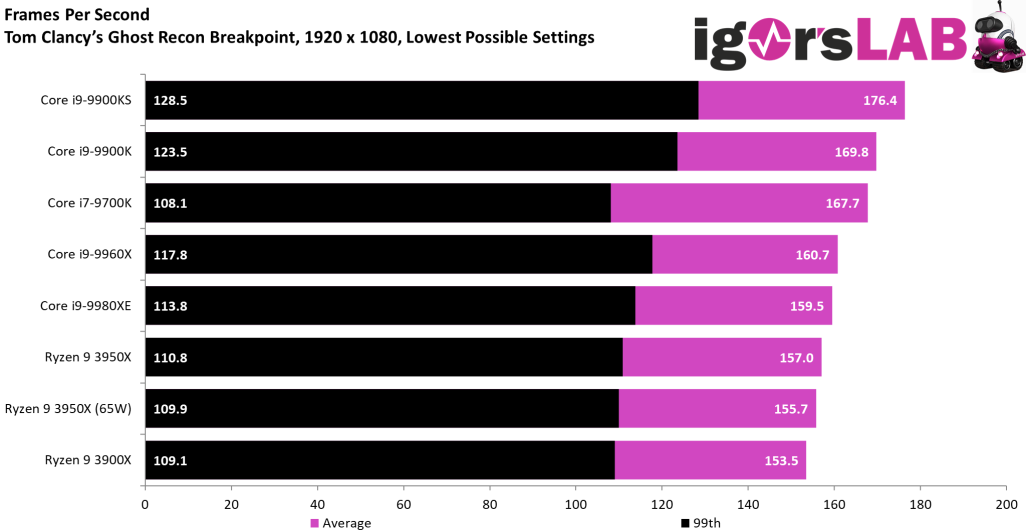
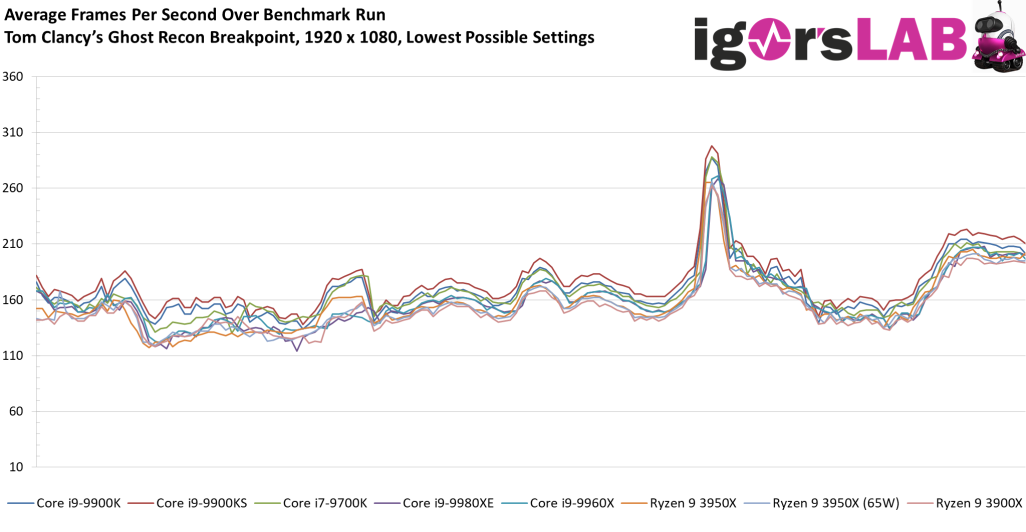
FPS comparison and percentiles of all CPUs
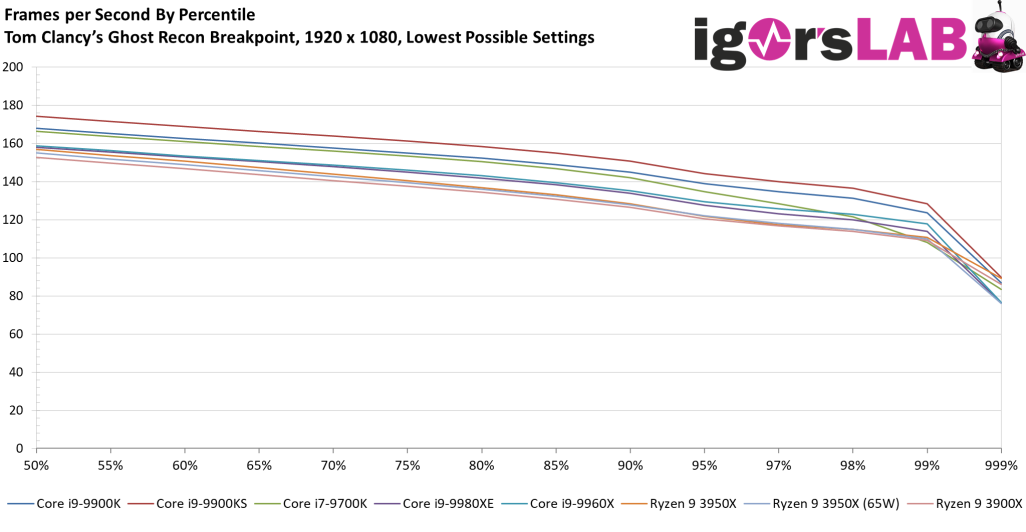
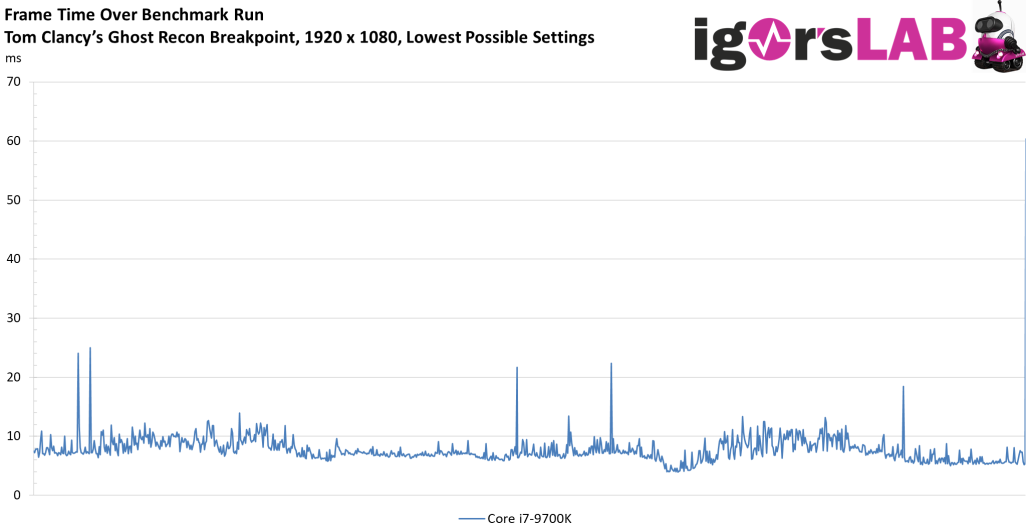
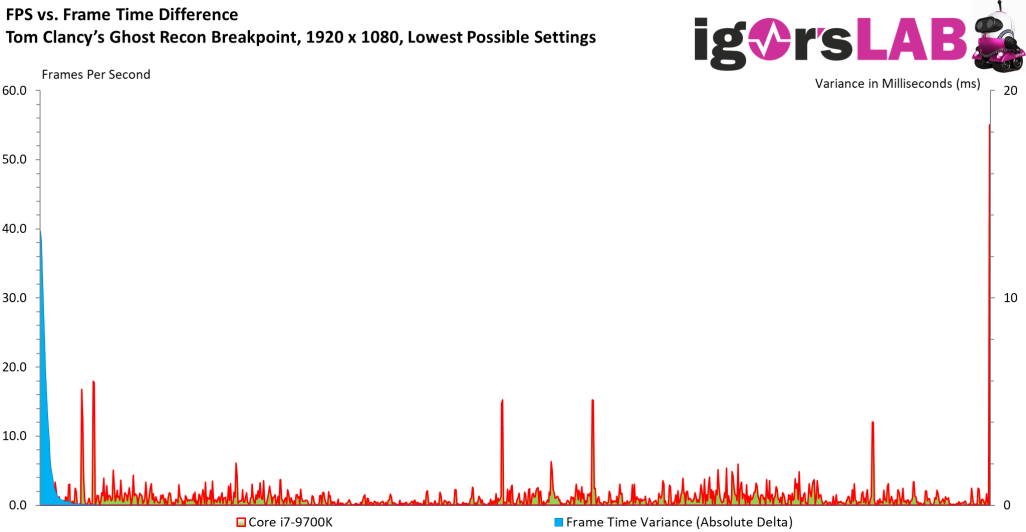
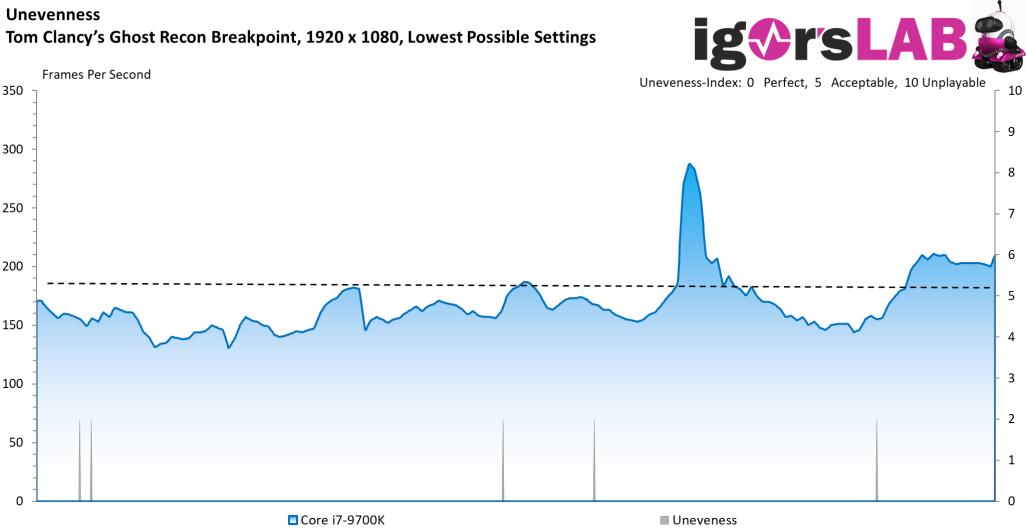
In the average calculated FPS, all Ryzen are behind the tested Intel CPUs. Now you could also believe that you would get the worse playing experience here, but that's not quite the case. The first conspicuous feature can be seen in the already mentioned Core i7-9700K, whose 99. percentile is already disproportionate to the average FPS. Is there something hopping?
The pure FPS course is all well and good, but it also says nothing about what a player feels directly. The curves cover them more or less and you can see nicely that such a second is a far too long interval, in which much sensory calamity can be hidden.
The curve with the percentiles shows the performance drop more clearly, but for such a long benchmark sequence is only half a statement.
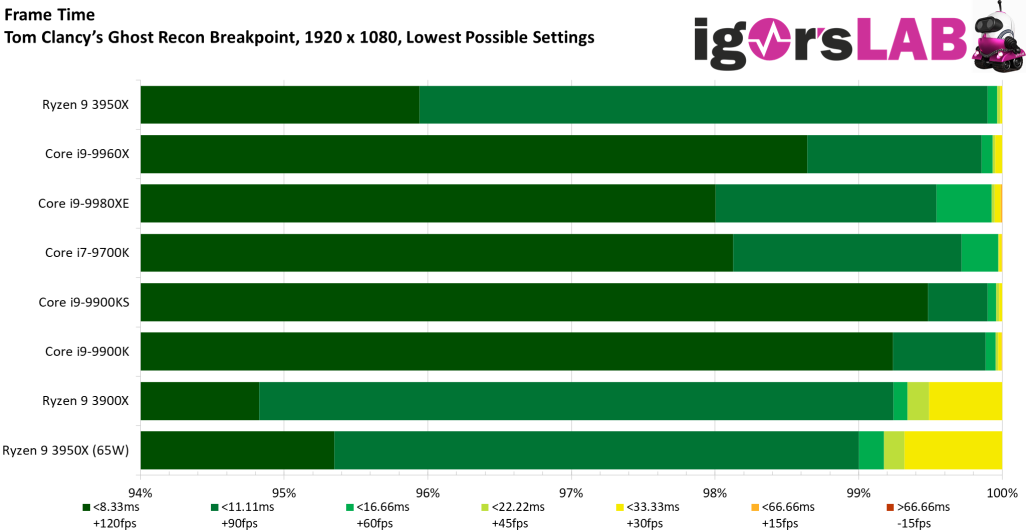
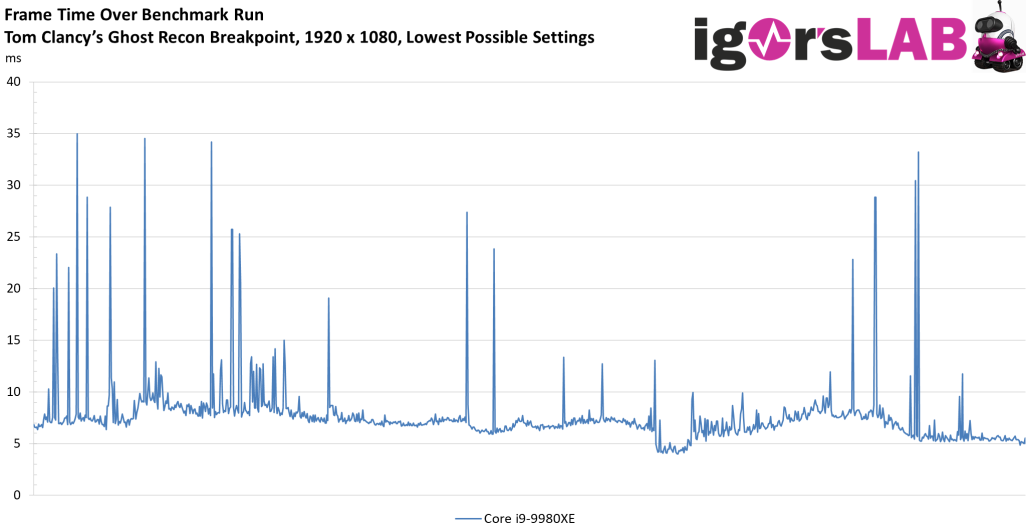
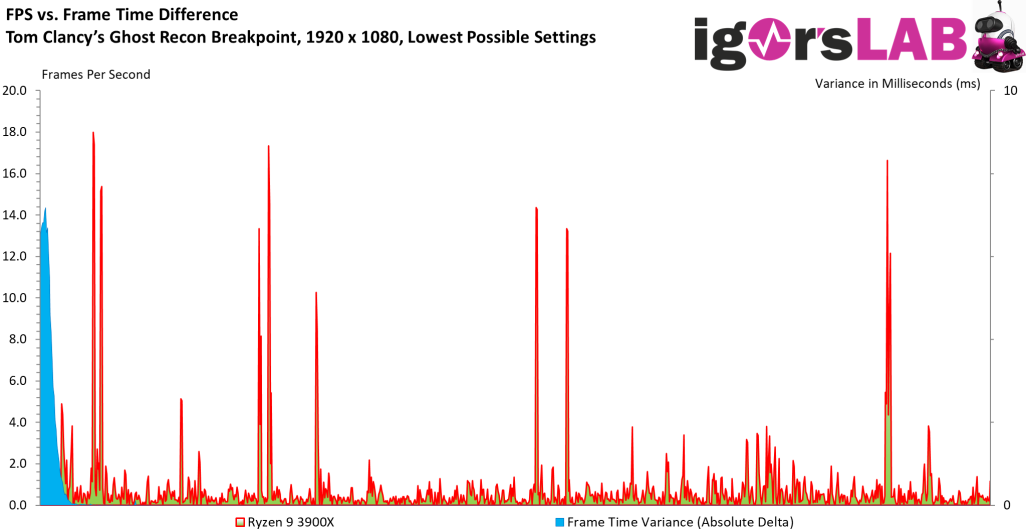
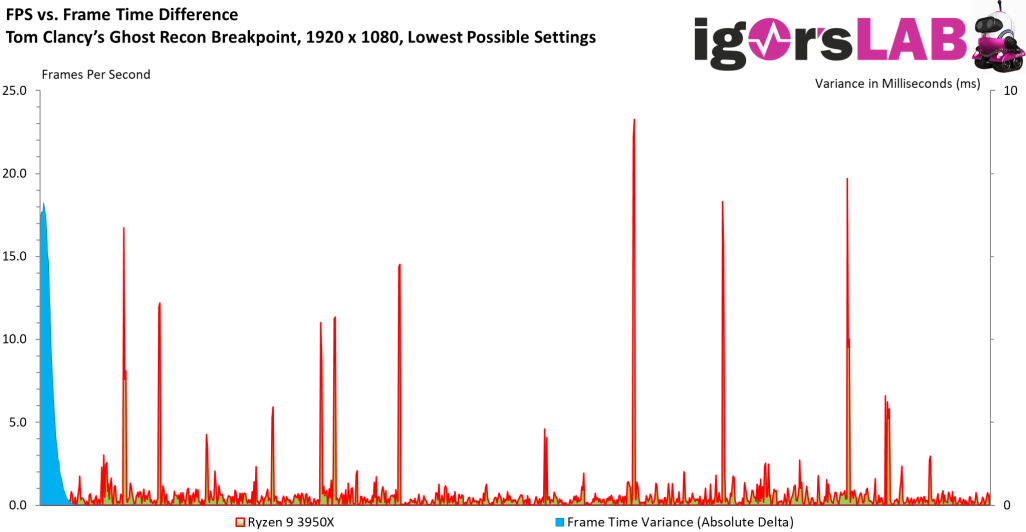
Now let's look at pure frame time. And behold, the Ryzen 9 3950X now suddenly offers the roundest image by far, even if it is not enough for the top of the FPS! Also interesting is the order of the Intel CPUs and the dropping of the Ryzen 9-3900X. The CPU with the worst percentiles is in the midfield here. So this approach is not quite enough and we have to look elsewhere for the causes.
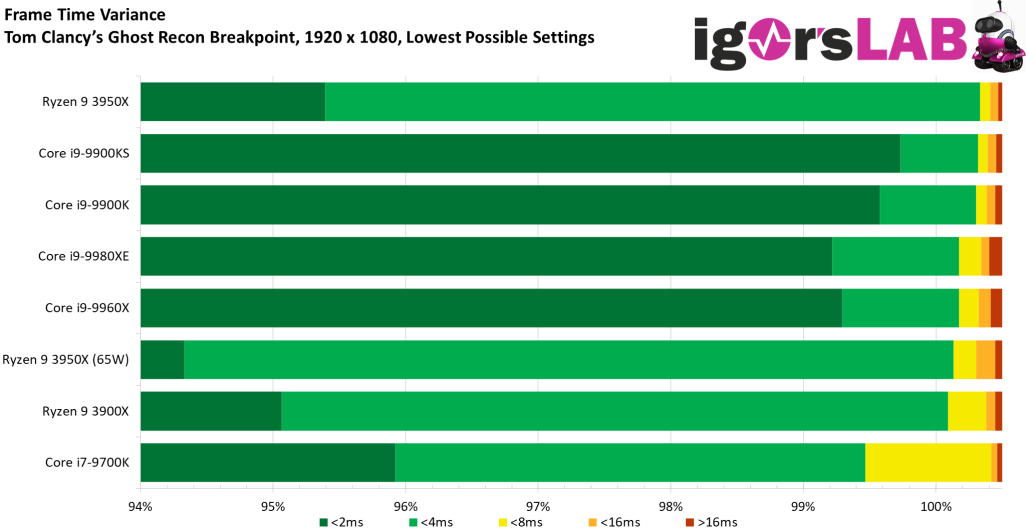
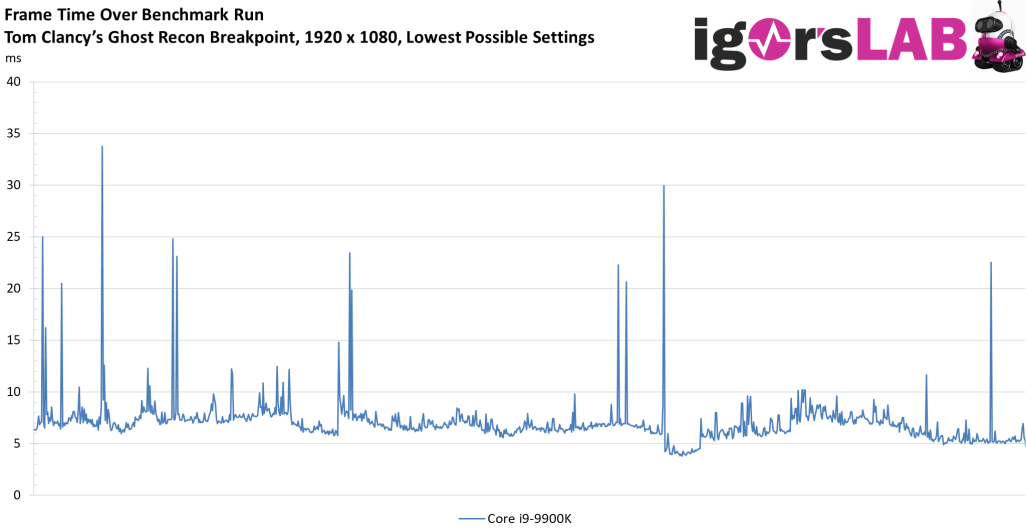
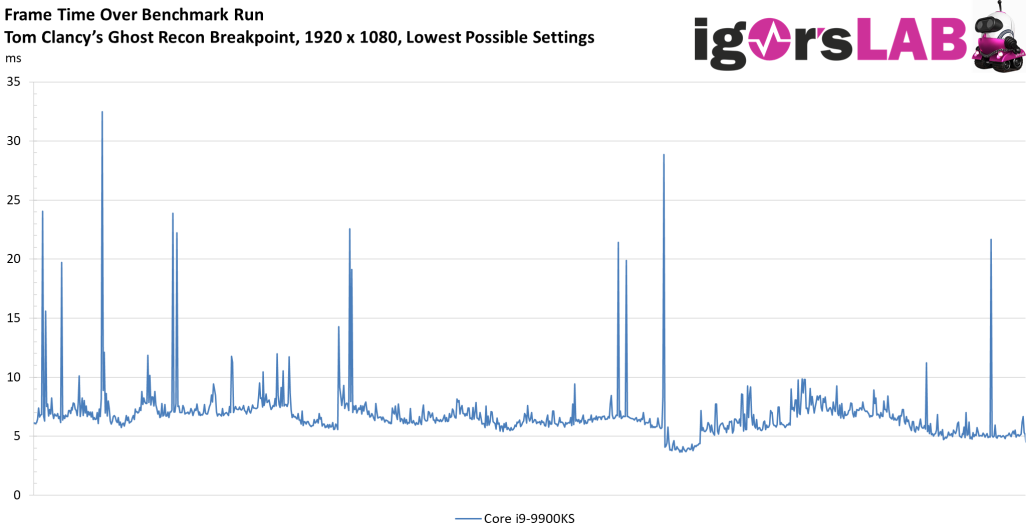
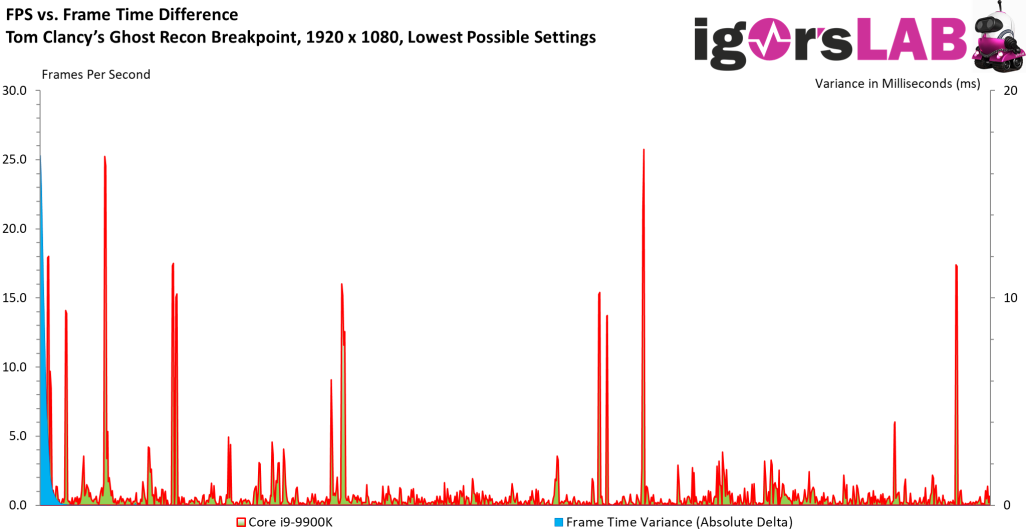
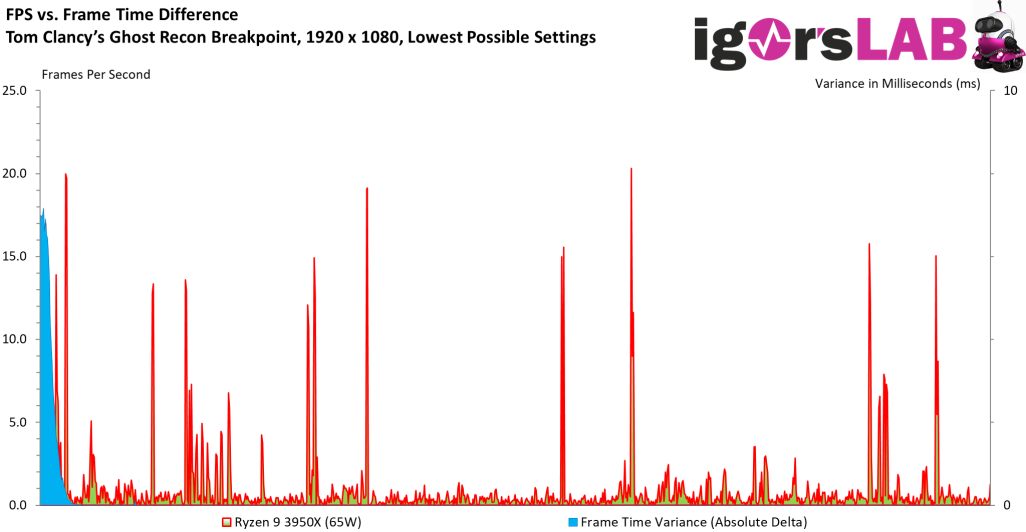
For this I calculate the variances, i.e. the temporal differences between two consecutiverender frames. And that's where the Intel Core i7-9700K in particular is sagging away a little bit and we finally have our explanation. Although the Ryzen 9 3950X is on average slower than a Core i9-9900KS, it still offers a total of approx. 78 watts at the EPS connection the quieter and smoother image. Also a realization! The CPU, on the other hand, which is slowed down to 65 watts, looks slightly worse than the original.
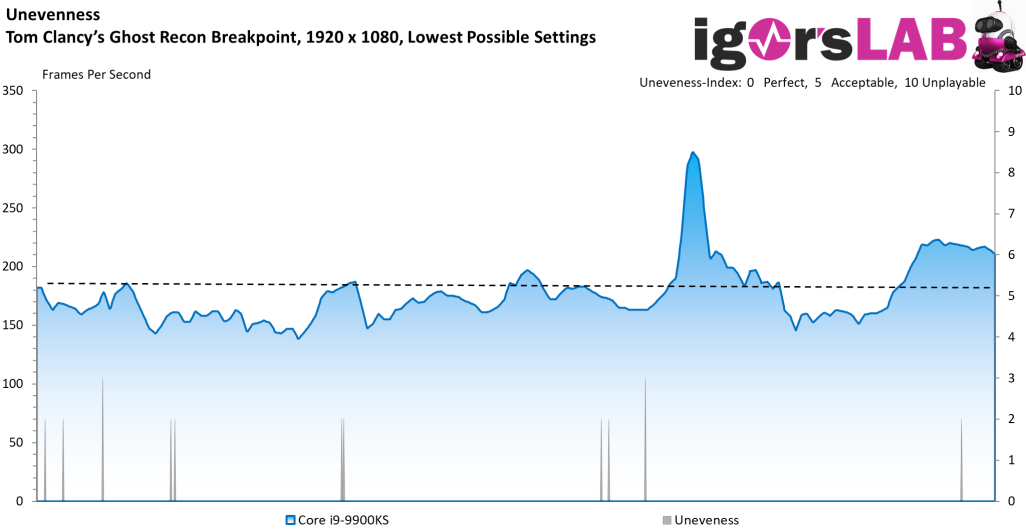
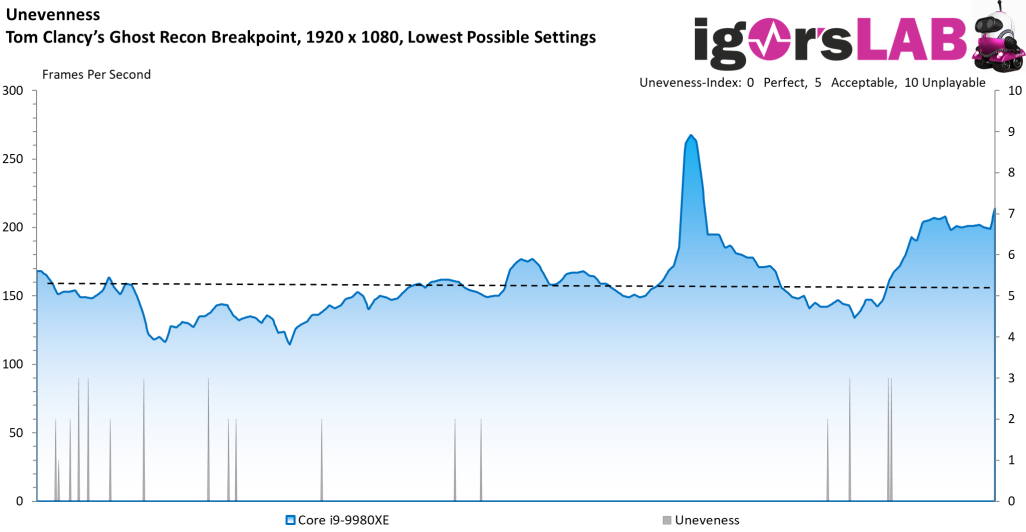
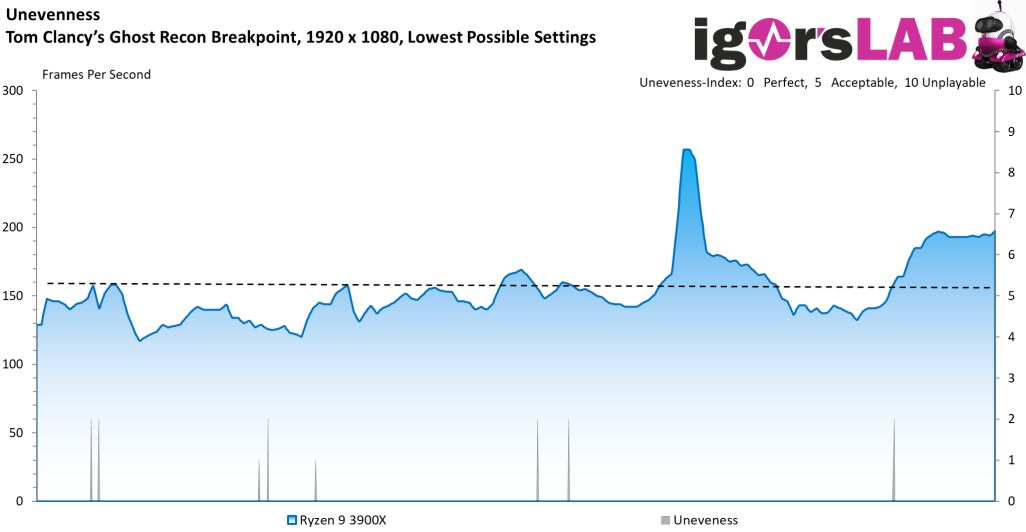
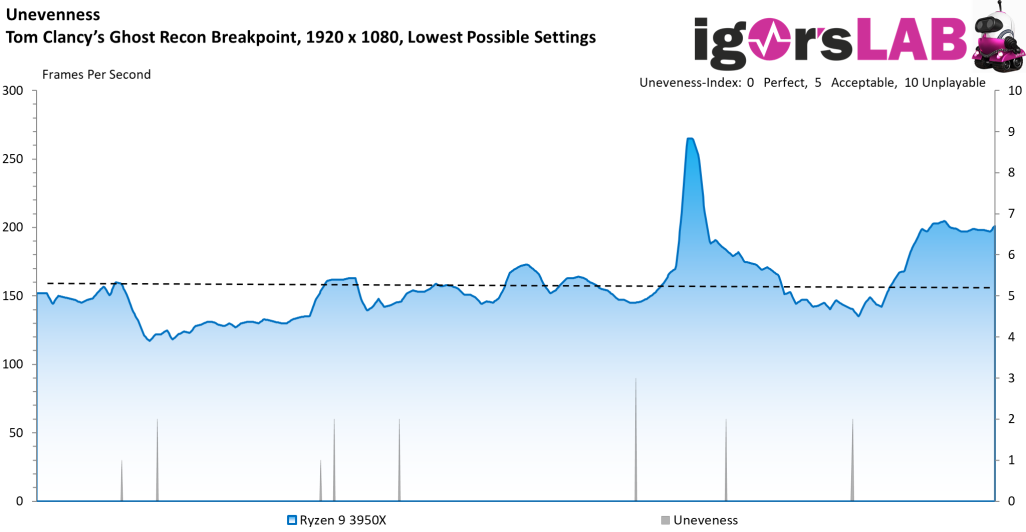
And since I am criticized again and again in various forums because of the bar charts, now all CPUs with individual frame time, the variances and the Unevenness index are also available again as a single graphic. Unfortunately, time does not give us more.
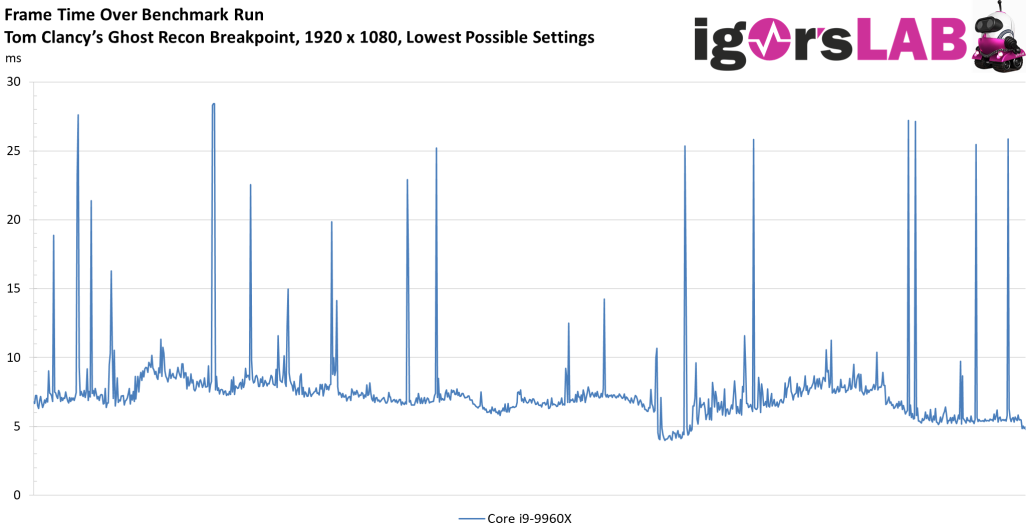
Single graphics for all tested CPUs


Kommentieren