


In the meantime I have even been able to evaluate four RX 5500 XTs and push them to the limit, whereby the 2.1 GHz is a real limit for all of them. Sure, with the LN2 version of the MorePowerTool you would probably get over it, but at what price? Instead, all cards reacted well-behaved, stable and without artifacts to settings that are still close to this limit with up to almost 2090 MHz and would be playable if only the clock rate had been taken into account. As we know, the bandwidth of the Navi 14 cards is unfortunately not the biggest and you will have to test how far you can get with the narrow 128 bit interface without any losses.
Factory OC vs. Wattman OC vs. MorePowerTool OC
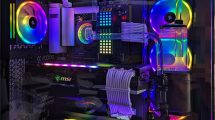
In the end, even the “untreated” card is an OC model ex factory. Nevertheless, you can add a small scoop to the Wattman without any further intervention. If the MSI RX 5500 XT was warmed up at about 1850 MHz ex factory, the Wattman can be used to increase the frequency to about 1950 to 1970 MHz, depending on the game. With a 5 percent increase in clock speed, you can achieve an average of 2 to 3 percent more performance. But this is an increase of almost 12 percent in power consumption. We don’t want to discuss this any further at this point, because in the end everyone has to know for himself whether it’s worth it, but it already shows the limits of what makes sense.
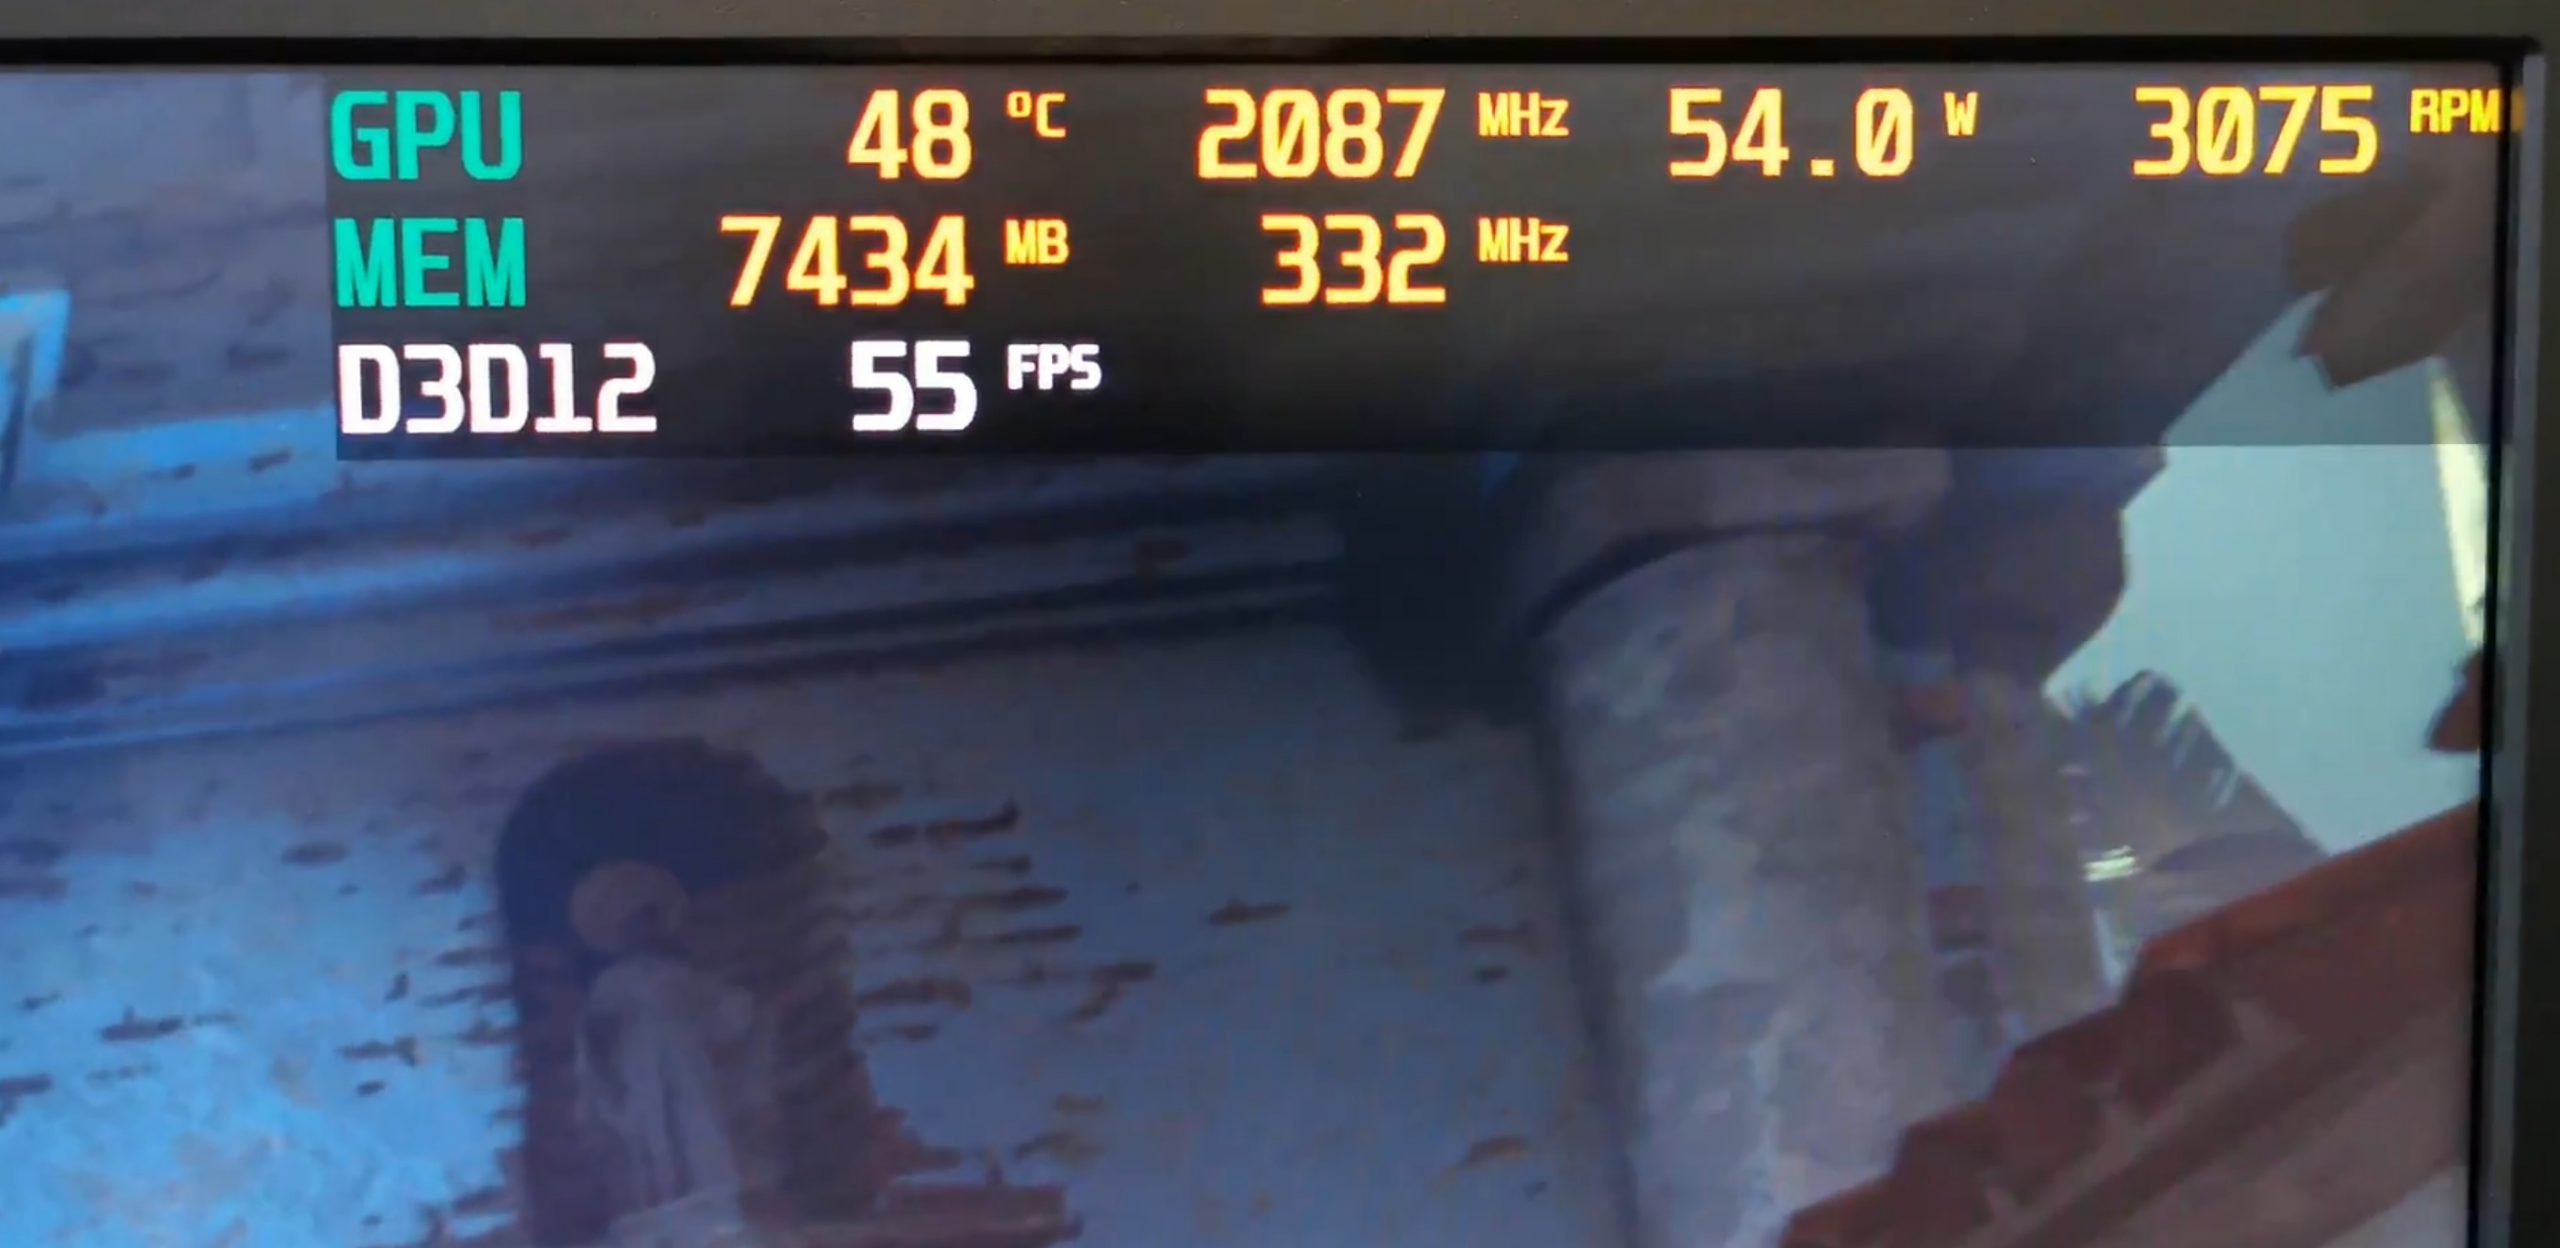
But what happens if you put 100 MHz on it again? For this you need the MorePowerTool (MPT), which you can download from our homepage. The instructions can be found there as well as the foreword. Which brings us to the maximum OC. The voltage is very high with 1.35 Volt, but it is (unfortunately) needed if you really want to keep it without artifacts. Depending on the chip, you can also set the clock to 2080 MHz and reduce the voltage to 1.3 volts. The fact that I flattened the voltage curve at the top so much is due to the stability, because the clock rates jump extremely back and forth in some games (especially within limits). The power limit is increased with 95% up, which I of course released in the MPT before, as well as the wattage for the GPU (GFX) of 200 watts and a value of 160 amps for the TDC. You can leave the SoC that way, if everything stays stable. The fans are now at 100% for clock reasons. Here, too, one can and must of course optimize later.

And what are the practical benefits of all this? Less than one might think, because in the field of power consumption there are now also partial detonations and ricochets. The highest value measured ex factory for the normal cycle was just under 145 watts (Witcher 3). Now the whole thing easily rises up to 175 watts (Three Kingdoms) and even 185 watts (The Division 2, Witcher 3). So in the end we invest more than 27 percent more electrical energy for approx. 5 percent more gaming performance, which one actually doesn’t even notice subjectively as a gain and which even in some games can lead to a much worse gaming experience if the bandwidth suddenly no longer suffices.

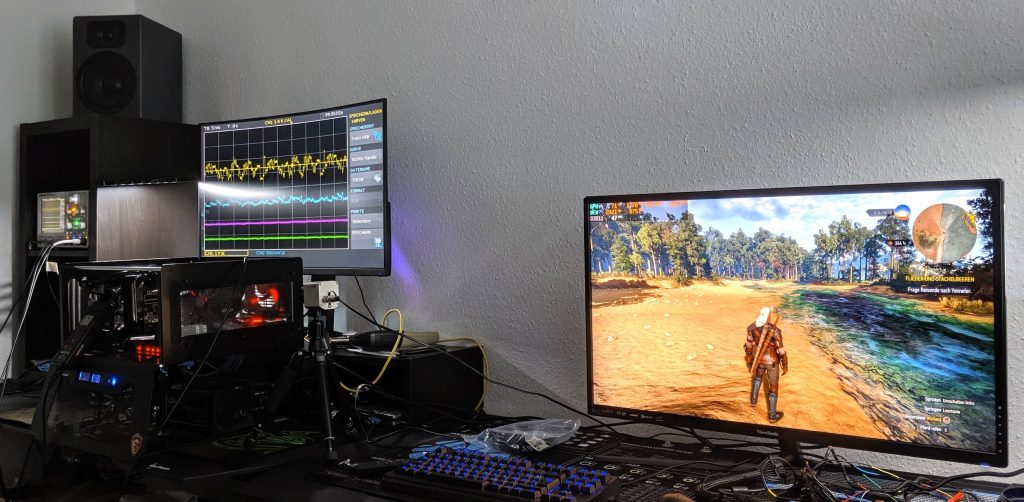
Today I will use selected examples to show what it looks like when you can or have to play either smooth or hoppy and the limitation is even visible in the power consumption in real time. Therefore I created many diagrams with the frame time, the variances and of course the power consumption. This ranges from a bit better to totally unplayable, although the clock rate always looks quite good on average. And for everyone’s peace of mind: PCIe 3.0 is not the reason. Of course, I also tested the worst case benchmark on an AMD system with PCIe Gen. 4 (R9 3900X, MSI MEG X570 Godlike) and registered exactly the same break-ins. Even though the small Navi card with the simple PCIe port, which is only connected x8, certainly benefits from the higher transfer rates of the PCIe gen. 4.0, bit it doesn’t change the situation-related memory limitation in itself if it occurs so clearly. But I’ll come to that in a moment.
Test system und software
As always, I benchmark with my own PresentMon GUI and the interpreter software that fills my Excel charts and extrapolates and interpolates the graphical output (and only the graphical output) so that all graphs are exactly long, thus creating a uniform and comparable time line.
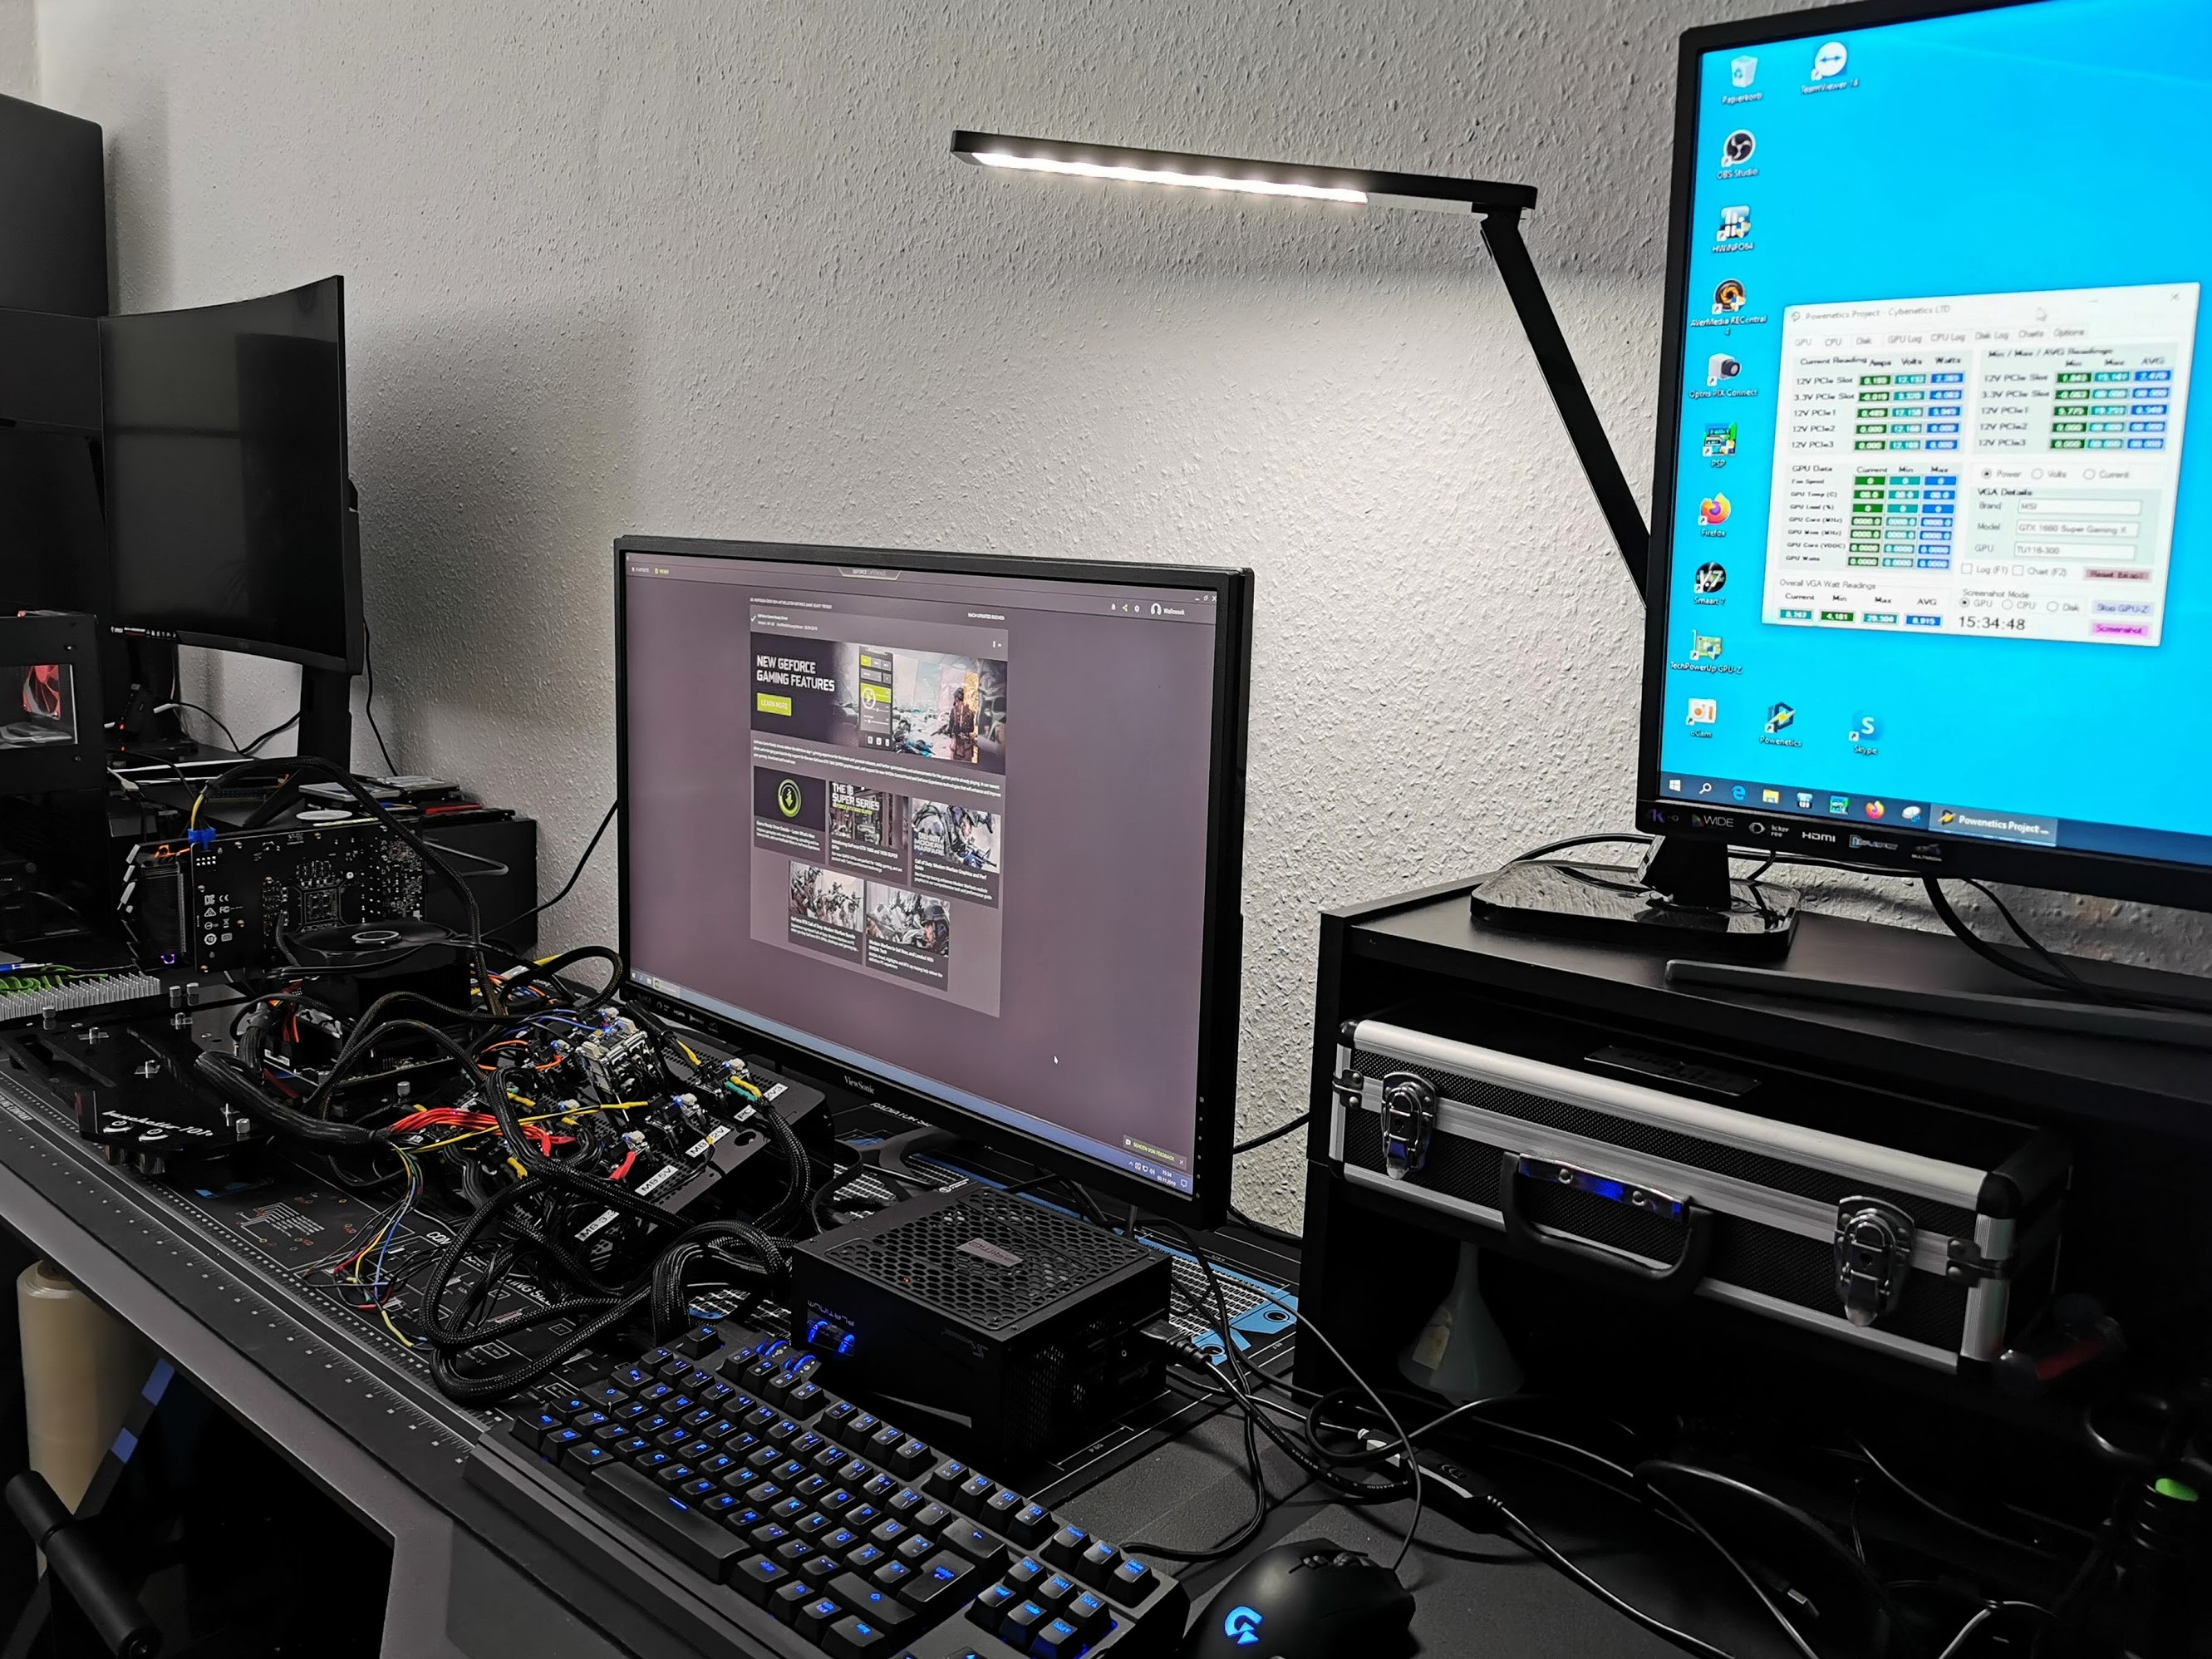
The remaining evaluations up to percentiles and bar graphs are based on the real raw data from the measurement. This time I also use a high-resolution measurement with the oscilloscope to explore the relationship between frame time and power consumption.
I have also summarized the individual components of the test system in tabular form:
| Test System and Equipment |
|
|---|---|
| Hardware: |
Intel Core i9-9900 K 4x 8GB G.Skill FlareX DDR4 3200 |
| Cooling: |
Alphacool Eisblock XPX (1151), XPX Pro (AM4, 2066) Alphacool Eiswolf (modified) Thermal Grizzly Kryonaut |
| Case: |
Lian Li T70, Raijintek Paean Open Benchtable |
| Monitor: | BenQ PD3220U |
| Power Consumption: |
Non-contact direct current measurement on PCIe slot (riser card) |
| Thermal Imager: |
1x Optris PI640 + 2x Xi400 Thermal Imagers Pix Connect Software Type K Class 1 thermal sensors (up to 4 channels) |
| Acoustics: |
NTI Audio M2211 (with calibration file) Steinberg UR12 (with phantom power for the microphones) Creative X7, Smaart v.7 Own anechoic chamber, 3.5 x 1.8 x 2.2 m (LxTxH) Axial measurements, perpendicular to the centre of the sound source(s), measuring distance 50 cm Noise emission in dBA (slow) as RTA measurement Frequency spectrum as graphic |
| OS: | Windows 10 Pro (1909, all Updates) |


Kommentieren